


Cities are powerful hubs where people meet, live, travel and work. Interconnected and complementary services and utilities allow for healthier and more highly educated populations, higher standards of living, and greater civic participation.
Data allows city governments to explore trends in use patterns for public services so that they can experiment with what structures that are already built can do; and take informed decisions on how to best use public transport, municipal waste collection, and civic services.
New forms of smart cities have long been emerging where innovations come through iterative experimentation rather than taking top-heavy, politically driven decisions. As priorities shift and technology leads to newer advances in what data and urban planning can do, ideas of what cities can be are changing. Here are four areas of urban planning that are witnessing this transformation and harnessing the power of data to plan iteratively, respond efficiently, and build a more equitable urban future.
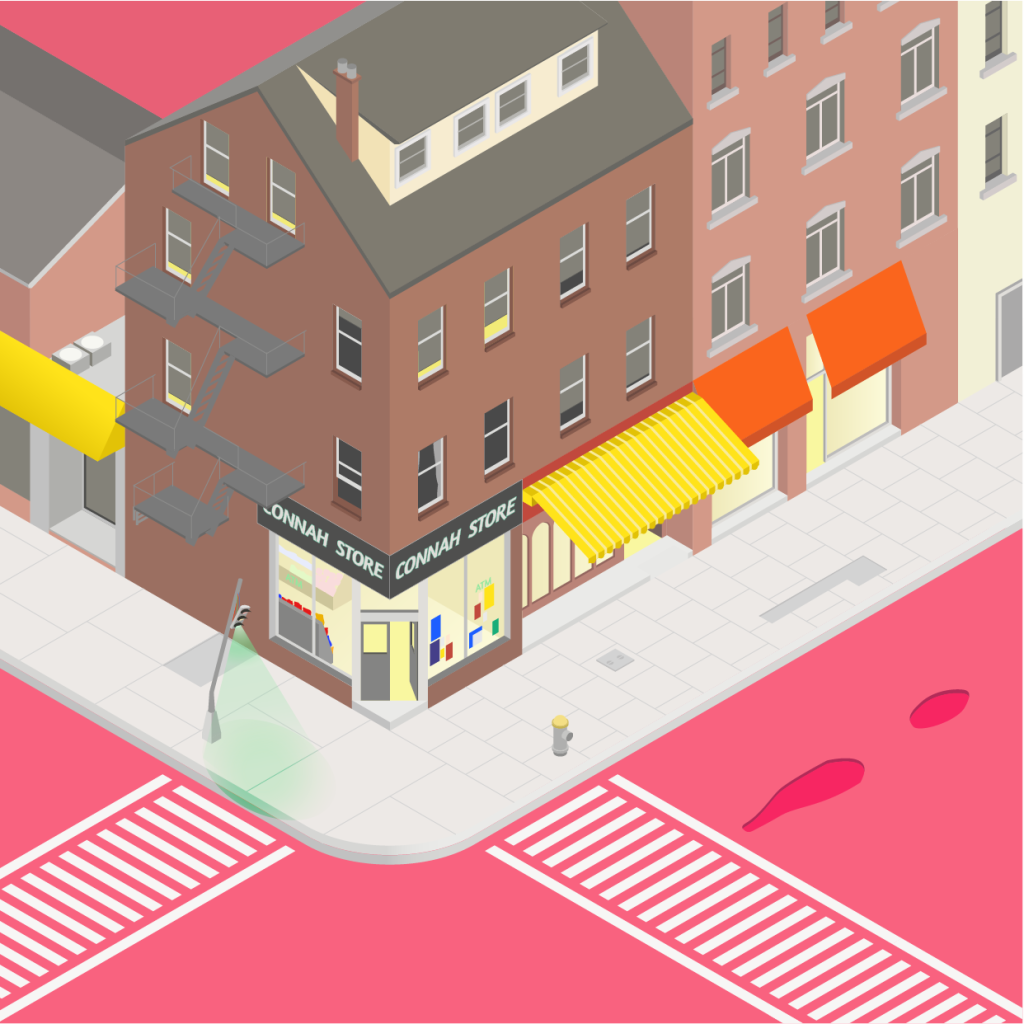
Transport: Mapping Matatus in Kenya

Illustrations by Afi Walker
In Nairobi, for decades, a dense, informal system of minibuses called matatus ran across the city. With overlapping routes and variable fares that had never been documented, it was taking 3.5 million of Nairobi’s citizens a long time to reach their destinations. In 2013, a team of researchers from MIT and the University of Nairobi set out to map the transport routes of 130 of these matatus (over 3,000 stops). This was then fed into an open-source General Transit Feed Specification system that allows the data to be used for travel modeling, and be fed into Google Maps. Google also used this example as a testing ground to input data into Maps for a transport system with frequently changing stops and schedules.
The results are clear: Nairobi has adopted the map as its official transit guide and more than 5,000 people had downloaded an online map by 2016. These users are finding safer and more efficient routes to their destinations using both paper and phone-based apps. Matatu owners are planning routes to serve underserved areas and avoid congestion, and use the data to calculate fixed fares. Most importantly, the case of Nairobi is also showing policymakers in cities like Dhaka, Manila, and Cape Town that informal transit systems are as important to take into consideration for public transport planning.
Solid Waste Management: Smart Governments, Smart Trash
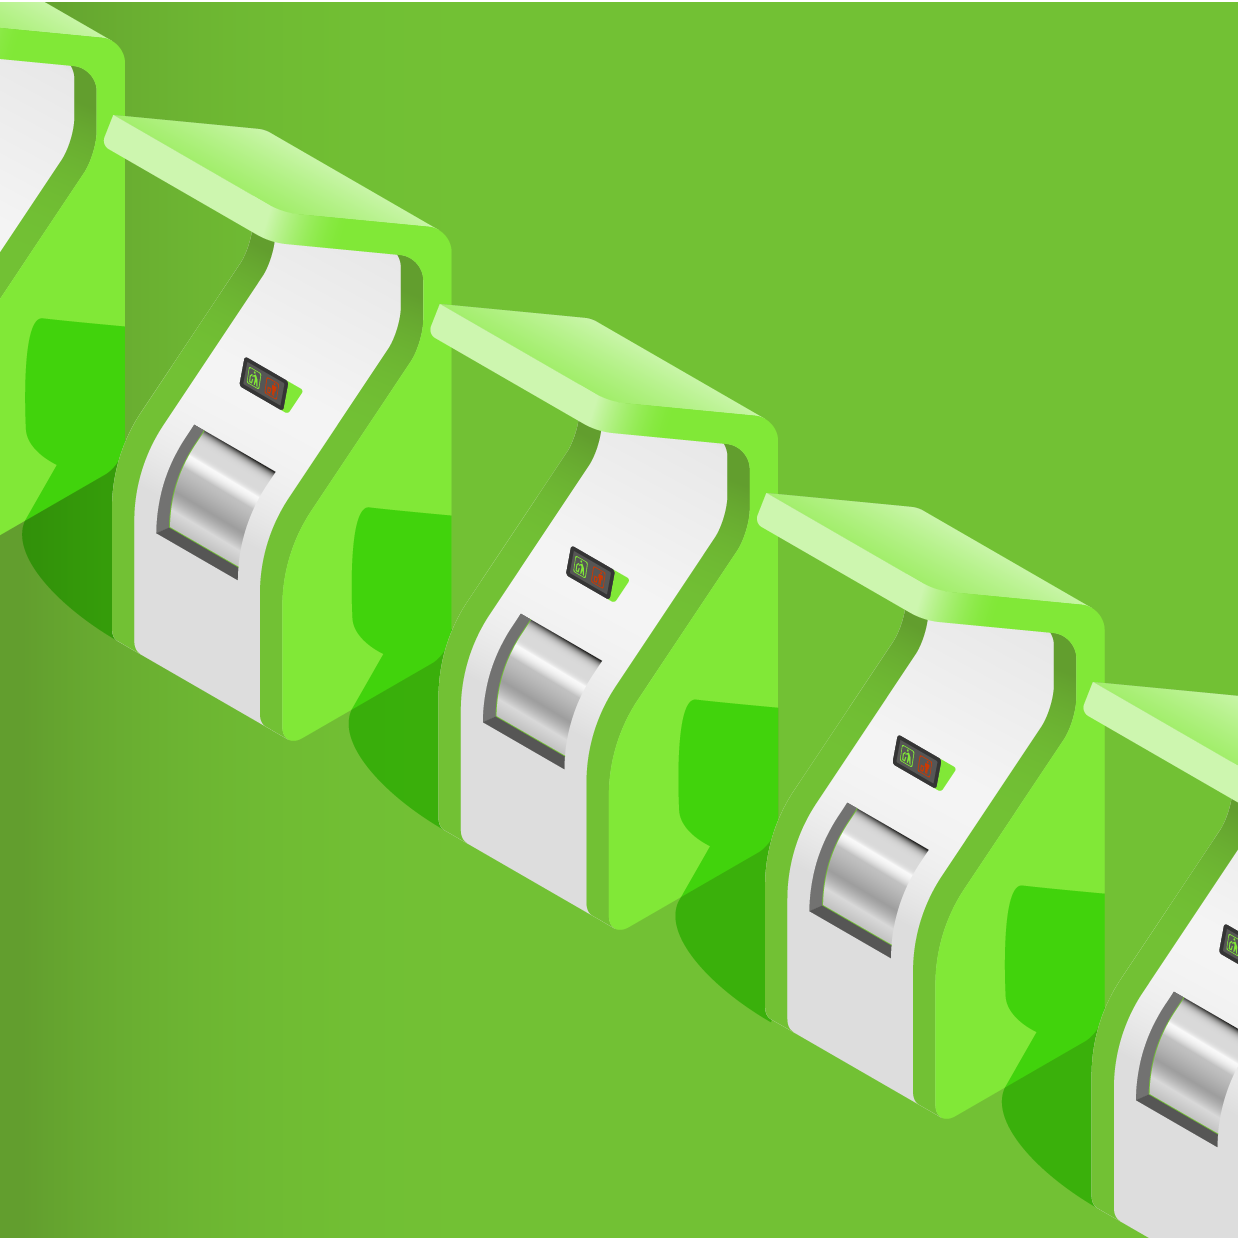
The UN predicts that 70% of the world will be living in cities by 2050, and solid waste disposal is expected to increase correspondingly. In cities like Seoul in South Korea, smart bins use RFID tags to connect to a centralised database that informs municipalities when garbage bins are full for pickup. In the nearby smart city of Songdo, a network of vacuum chutes channel waste directly to processing stations. In both cases, citizen ID is required to operate the bins, and users are charged according to the weight of the garbage generated. This works as an additional disincentive for generating high volumes of trash.
Putting Informal Housing on the Map
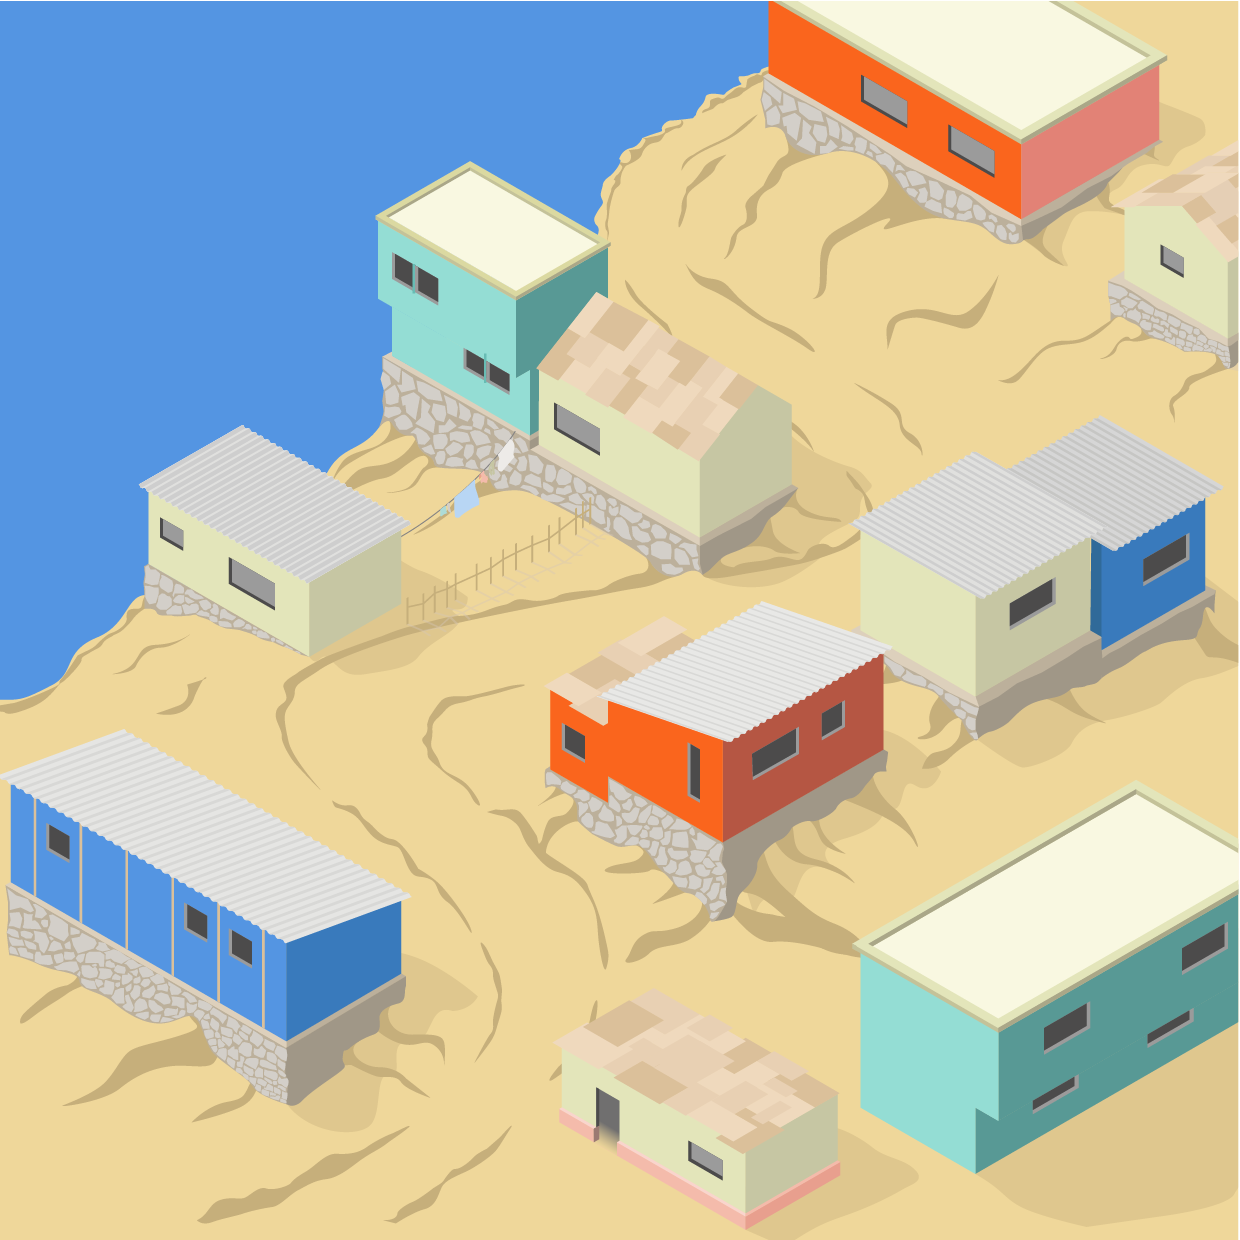
Organisations such as Humanitarian OpenStreetMap Team (HOT) and i’mappin are mapping communities living in informal housing in order to increase their visibility so that their needs can be considered for urban planning. Mapping their environment allows urban planners and governments to identify their needs and fill gaps in service provision, so communities can have access to flowing water, stable grids with backups for renewable power, public healthcare facilities, proper garbage disposal and incremental housing grants, among other things.
HOT uses volunteers to map vulnerable areas across Africa in order to make information available for humanitarian action such as disaster risk reduction or response, and for the provision of energy, public health, transport, water and sanitation services. They make the information open source and work with local implementation partners in government, NGOs and communities to help take action. Some of their recent projects include using mapping to fight gender-based violence in Western Uganda, administering Covid-19 vaccines in South Sudan, and helping refugee communities in Malawi find information about the communities in which they are staying.
i’mappin is doing the same for 140 million people living in slums across Latin America. Starting out of Lima, Peru, they use geospatial mapping to identify households, green spaces, and transport in an area and raise awareness about residents’ needs. They have identified that 9 out of 10 people in Lima live with a basic need that is not being filled (water, housing, electricity, health or employment), 4 million live in situations of vulnerability, 70% of households in the metropolis are self-constructed, making them unlikely to be connected to electricity, water and healthcare provision, and making over 200,000 of them likely to collapse in the case of natural disasters. By drawing attention to these needs and opportunities, they create a conversation with policymakers and planners towards equitable growth in the city.
Using Digital Spaces to Increase Civic Engagement

The creation of Boston’s 311 platform over a decade ago paved the way for cities to use citizens as eyes and ears for reporting non-emergency municipal issues. 311, like 911, was initially developed as a phone line that citizens could call to report potholes, broken streetlights or traffic signals and missed garbage pickup, among other things. The City of Boston realised that citizens were even more engaged when they could see the status of requests being sent in online and opened the data for public use. This has led to innovations including an open-source dashboard created by university students, using data from the website.
During the Covid-19 pandemic, demand has grown for online options to complete public service procedures such as the payment of utilities bills, changes to their addresses, gender or civil status, and access to public health records. In Latin America alone, the IADB estimates that the number of government transactions has nearly doubled during the pandemic, from 21% to 39%. Despite gaps in internet access – 1/3rd of Latin America was not connected to the internet in 2018 and internet literacy is only 52% in highly connected Chile -, the option for internet facilitation of processes can make online government processes faster and more accurate, freeing up resources for citizens who access them in person.
As in Boston, initiatives like InvestmentMap adopted by Paraguay, Argentina, Jamaica and Colombia open government data to citizens to increase transparency and accountability and create greater trust in institutions in contexts where bureaucracy may previously have been viewed with suspicion. In a study done in Buenos Aires, just learning that the government had published their pledges online made a group of citizens 9% more likely to trust them, with the true determinant of trust in government being dependent on how they followed up on these pledges.